
Greening Digital #2 - OMGCLIMATE and how to hide carbon emissions
Greening Digital #2 - OMGCLIMATE and how to hide carbon emissions
The one written on a train from Chester to Glasgow, after hanging out at DoES Liverpool.
I’m writing this on a train from Chester to Glasgow, as part of my slightly ridiculous experiment of trying out interrail passes for business travel. So, hello from a train again.
Here’s the menu for today:
1.1 OMGCLIMATE London on Friday 18th Oct
1.2 A closer look at Amazon’s climate reporting, and the bit that’s a bit sneaky
1.3 Link Grab Bag - developments that caught my attention, and are worth monitoring in future.
1.4 A request for notes, and what you want to hear about
1.2 OMGCLIMATE in London on Friday Oct 18th
Are you in London on Friday Oct 18th?
Are you interested in a free unconference about tech and climate change, to explore the things covered in this newsletter with other like-minded souls?
I’m working with a few London friends to organise OMGCLIMATE, which is exactly that kind of event.
There’s a handy tweet about it you can share that links to an explanatory blog post.
We did one in Berlin earlier this year, and it was life affirming and informative in roughly equal measures - come along!
Getting tix
We’re releasing tickets in the coming days, but you can jump the queue with these top secret links:
If you'd like to see something done where you work about climate change. You're interested in exploring a question you've brought with others, or helping others do the same…
Register as an attendee - https://ti.to/omg/climate-london/with/pv9sq-awdgu
You're interested in coming, and you're up for helping facilitate a session too…
Register as an attendee and facilitate a session - https://ti.to/omg/climate-london/with/nvro-vic98o
Please don’t tweet these links, but it’s cool to share them with friends / colleagues - especially if it helps get more than just white dudes who program along.
1.2 Following up on Amazon’s climate announcement — the bit that’s a bit sneaky
In the last newsletter I spoke about Amazon announcing its carbon footprint ,and said this about their report:
after looking into the numbers a bit more and asking People Who Know, it looks like Amazon is doing something a bit tricky on reporting with their carbon numbers for electricity use.
Some people responded, asking what "tricky" means here, so I’ll try to summarise why the way they report isn’t ideal.
Disclaimer: I’ve tried to simplify it as much as I can. I really have.
How you’re supposed to report CO2 emissions as an organisation
If you report CO2 emissions, there’s a generally accepted approach to talk about emissions in terms of “scopes”. There’s stultifying, extensive detail available from the GHG Protocol, the organisation that defined the approach. I use this slide below to explain it in talks:
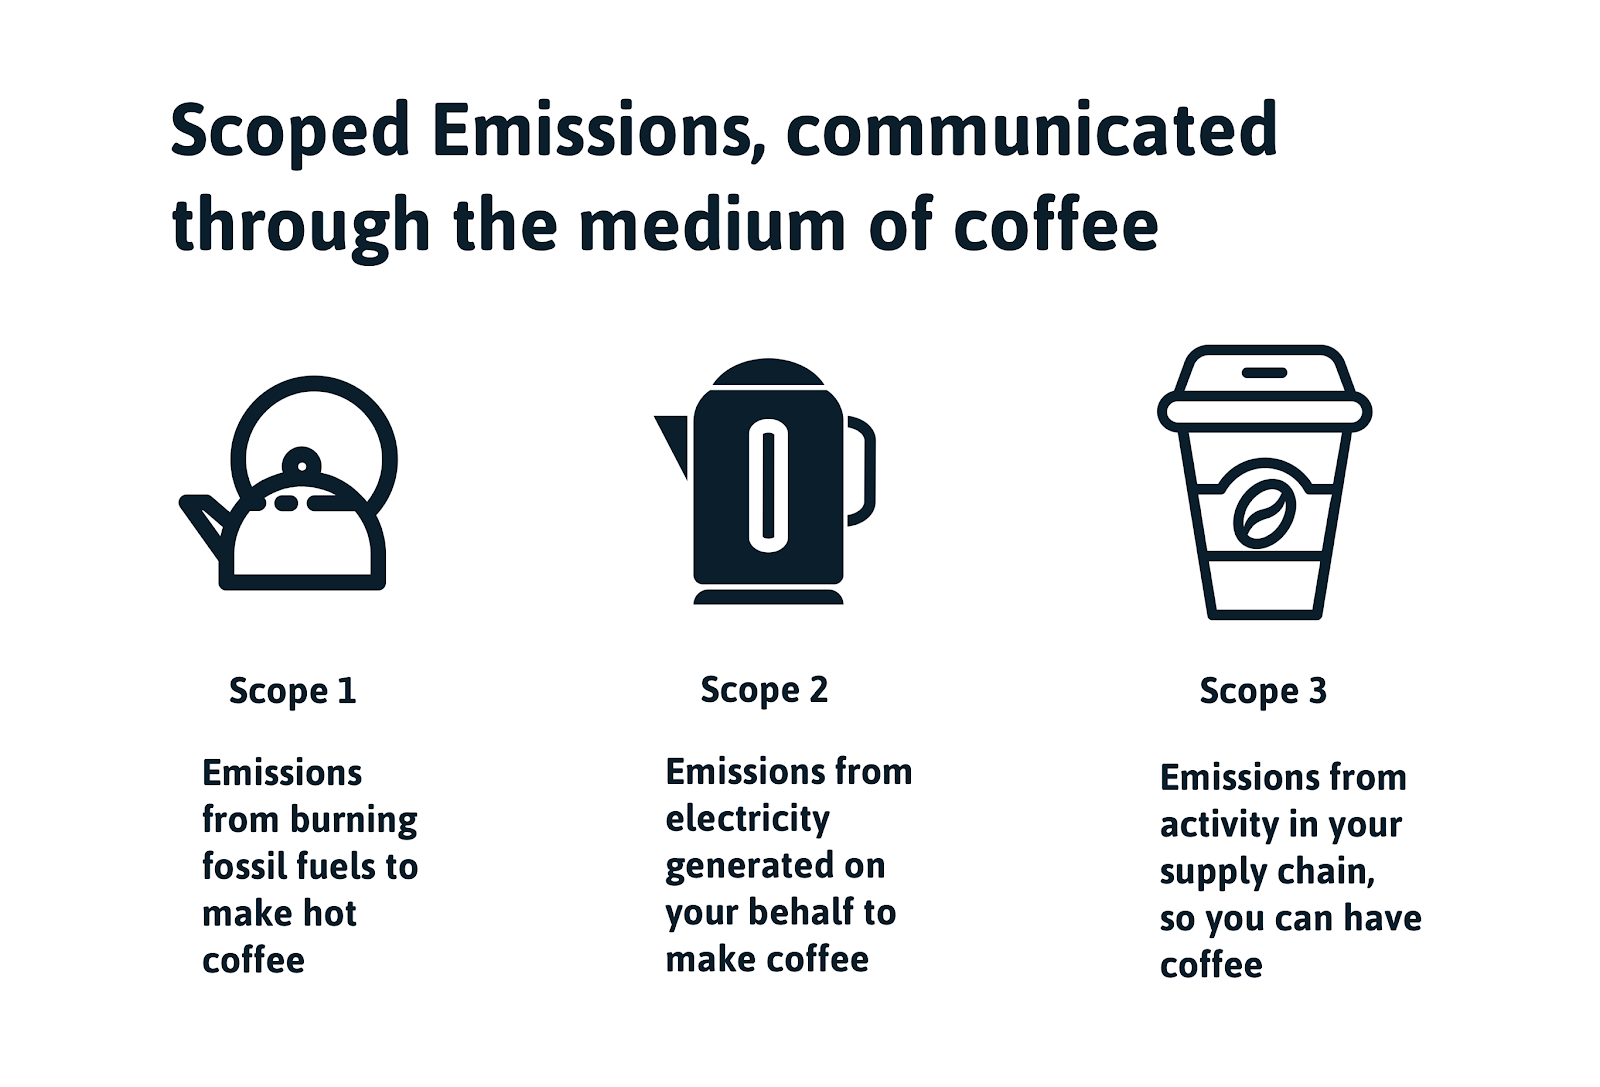
If that image didn’t help, here’s the abridged, textual version:
Scope 1 is from emissions from activities from burning fossil fuels yourself to heat buildings, power cars and so on
Scope 2 is from other people burning fossil fuels for you, so you can use the electricity you buy
Scope 3 is pretty much everything else in your supply chain. It’s often hard to measure directly, because to do it precisely, everyone in your supply chain needs to know and be able to tell you their own Scope 1 and 2 emissions.
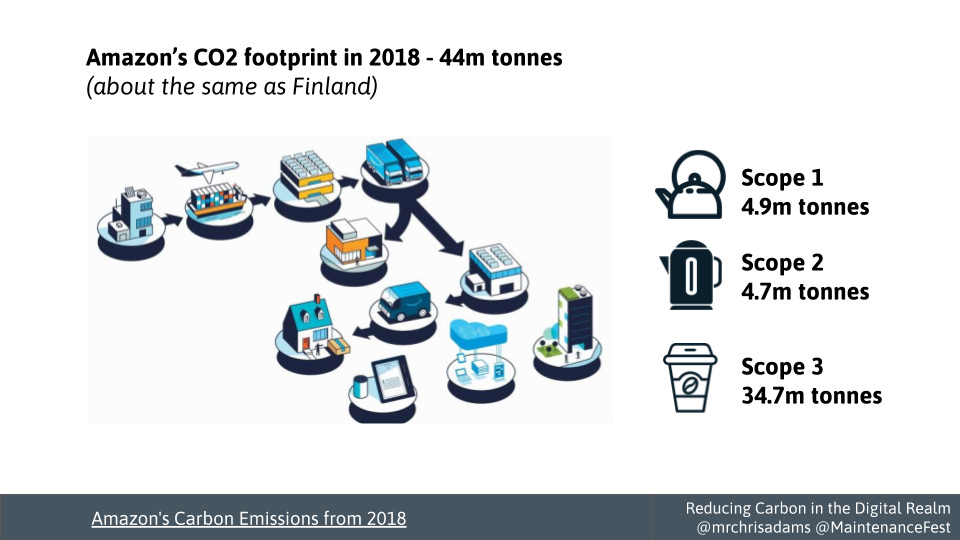
For context, here’s Amazon’’s footprint, with the numbers taken from their own sustainability site. They have their own fleet of plans, Amazon Air, so they have a lot of scope 1, and they run lots of servers, so they have high scope 2. They also have a huge supply chain, so big scope 3.
Now here’s Google’s own reporting, from their own sustainability report:
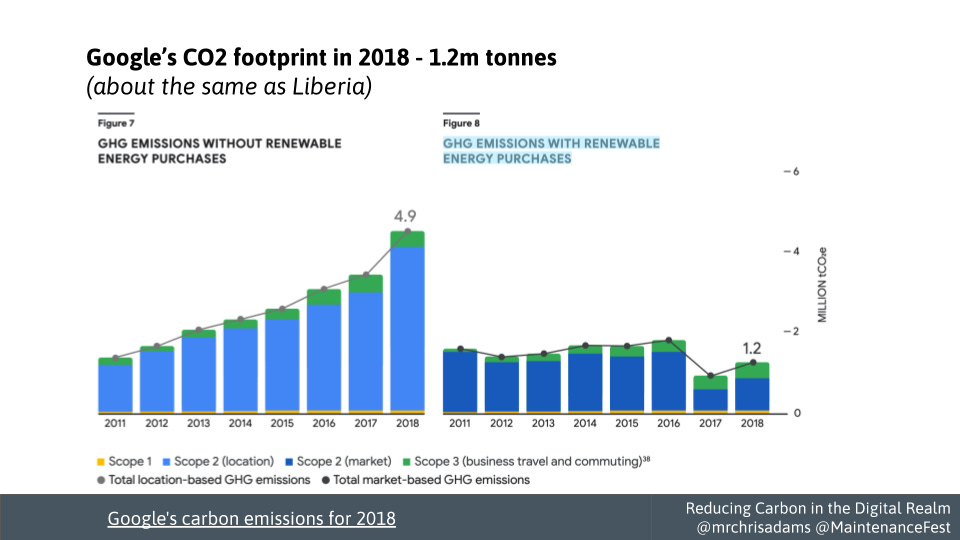
Google uses loads of servers, so of course they’ll have massive scope 2 emissions, but look how one of the graphs is so much smaller than the other - this shows how there are two ways report these kinds of emissions.
If you look only at the electricity used, and take the figures for carbon emissions for energy from the grid where Google run their servers, you end up with figures on the left. This is how much carbon is being emitted by using all that power.
This is because, for the most part, we get our electricity from a national or regional grid.
Why you have two charts
We don’t get to choose to only draw small-batch, free range, super green electrons that have only come from a happy wind farm. We just get electrons from the grid, and carbon intensity of that electricity will be an average of all the generation going in.
So, on a grid where all kinds of power stations, solar arrays and wind farms feed electricity into it, you’ll end up with a carbon intensity figure that might not represent your specific actions and choice of supplier.
Location based vs market based reporting
Because of this, it’s useful to use location based reporting for electricity, like we see on the left chart. This gives us an idea of the actual emissions from the electricity at the point of use.
However, this doesn’t recognise the billions a company might pour into decarbonising their energy, which is not ideal. To incentivise that, it’s common to use the chart on the right as well, to show what the emissions are, after you take into account investments in green power, or other financial instruments you might use - otherwise known as market based reporting.
This is why Google has two figures.
One of them, called location-based reporting, gives it a carbon footprint of about 5million tonnes - for me at least, this feels like the honest one to use.
The other, using market-based reporting comes to 1.2 million tonnes - this sounds much better, and it at least gives an incentive to make these investments in the first place. But there is also a downside.
How to mislead people with these numbers
If you only report the numbers in the chart on the right - the market based reporting, two things can happen:
you can mask the true size of your emissions from your use of the grid - as you’re only showing figure after your adjustments.
you can also get away with making green investments that might be cheaper than others, and make you look good, but do very little to decarbonise the colossal amount of power that you do use
One example of these less effective green investments might be buying green power credits from where there’s loads of green energy already, like Scandinavia. You might then use them mask the emissions where the energy grid is much dirtier, like Northern Virginia, where most of the US data centre infrastructure is now located.
This is allowed if you want to follow guidelines around reporting to the letter. But then again, so is paying almost no tax on billions and billions of revenue if you’re a huge tech company. It might be legal, but whether it’s right is another matter.
What does Amazon do?
The figure used above, in their own report is yep, you guessed it, market based reporting. Their own report says so:
Amazon reports emissions according to the GHG Protocol’s “market-based” method, which accounts for renewable energy Amazon purchases to support its operations.
There’s also no location based reporting, nor information about what instruments are used for market based reporting.
This is less transparent than it should be, and yes, it’s dull, but it’s also important.
Okay, time to get out the rabbit hole. Thank you for coming with me on this journey.
1.3 Link Grab Bag - developments that caught my attention, and/or worth monitoring in future.
Cassie Robinson has a really nice piece about building an enabling environment to make it possible to look beyond solutionism, when it comes to facing the climate crisis. Go read it on medium
Uber started talking about sustainability too now. You can see their post on medium. And their response to me asking the questions outlined in the greenwash litmus test.
I did a talk about The festival of Maintenance about Reducing Carbon in the Digital Realm, and the slides are online. They might interest you. I’m happy to answer questions about them in replies to this email.
Later, on October 25th Climate KIC are organising a global hack-thing, they’re calling the Climathon. There are some well defined challenges on their site, if if you want to roll up your sleeves and take part.
In November, the EdgeRyders, are organising a distributed festival, partly exploring what they are referring to as Deep Green Tech. They’re an interesting bunch, and it’s worth a gander. See more on their site.
We know that high CO2 concentrations in the sky are bad news for the greenhouse effect. It turns out that high CO2 concentrations inside buildings measurably affect your cognitive functions. Here’s some peer reviewed paper backing up these claims. What’s more many workspaces (likely including your own) are already at concentrations where the effects are measurable. I’ll write about how you can track this in a future issue, some nice folk showed me how you can measure this in DOES Liverpool, and I figure some of you might want to know too.
1.4 A request for notes, and what you want to hear about
Got something to say? Did I get something wrong? Is there an area you’re curious about being covered in future? Let me know, by replying to this email.
It helps me work out future content, and I’m finding the feedback I get really useful for motivating me to write.
Finally, as ever, feel free to share this newsletter with friends.
C